In the 17th century, Fermat wanted to find the lowest (minimum) and highest (maximum) points of a curve within a certain range. Fermat noticed that at these points, the tangent lines were horizontal, and therefore the slope of the tangent line at these points is zero.
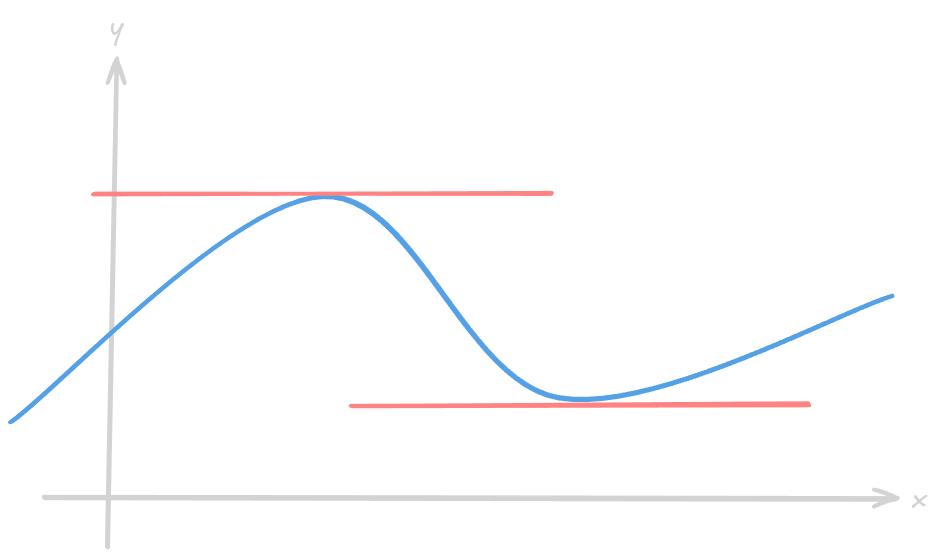
In that way, Fermat noticed that the problem of finding maximum and minimum points is related to the problem of finding tangent lines.
How to calculate tangent lines
Consider the following graph:
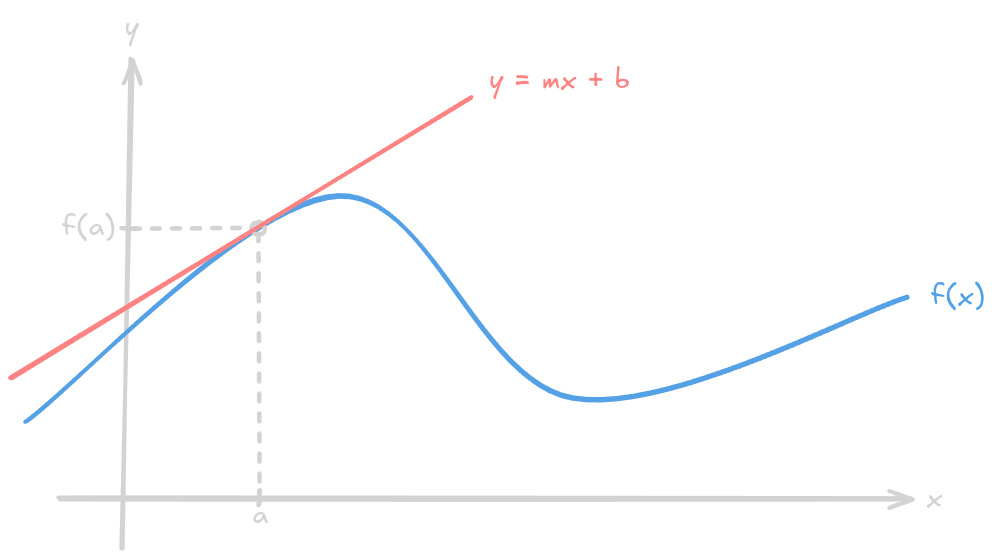
In the image above we have represented a graph of function in which is highlighted the point . The goal is to calculate the tangent line at this specific point — the red line.
Every line can be represented with the following equation:
in which:
- is the ordinate of the point of the line
- is the abscissa of the point of the line
- is the slope of the line
- is the y-intercept of the line
is defined by the equation of the tangent of the angle that certain line makes with the x-axis, therefore .
Given this definition, it is possible to calculate from two points in the line with the following equation:
But we do not have two points, we only have one point and we have to find out its slope. A way to think is to consider a secant line in the function graph:
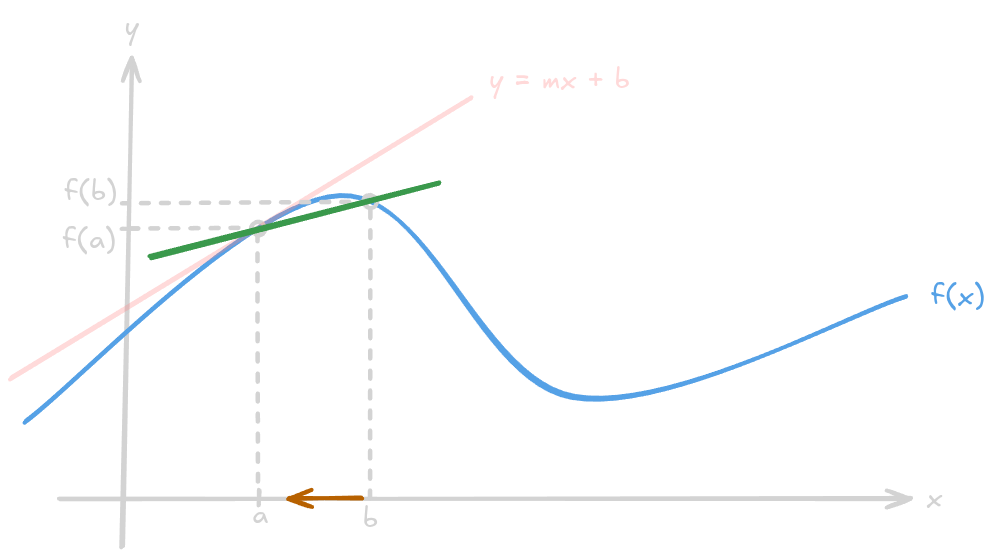
In the above graph we added the point and drawn a secant line passing through the points and . At first, this might seem trivial, but we can come to the conclusion that as the point approaches the point , the secant line gets closer to the tangent line of the point . Look the graph:
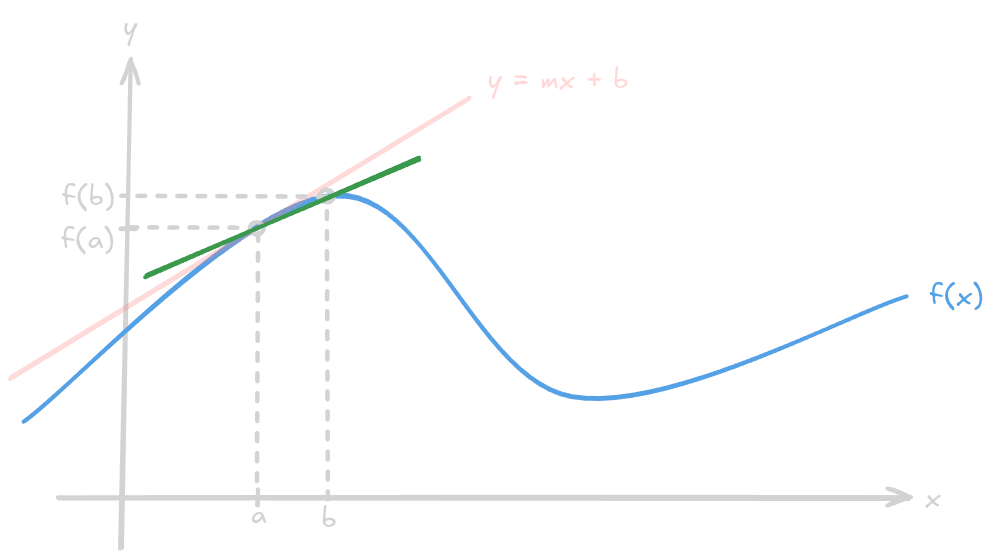
In that way, we can use the idea of Limits to understand that while approaches , the slope of the line that passes through the points and approaches the slope of the tangent line of the point .
With this understanding, we can now draw a right triangle to decipher some values and finally get to the equation that defines the tangent of the point :
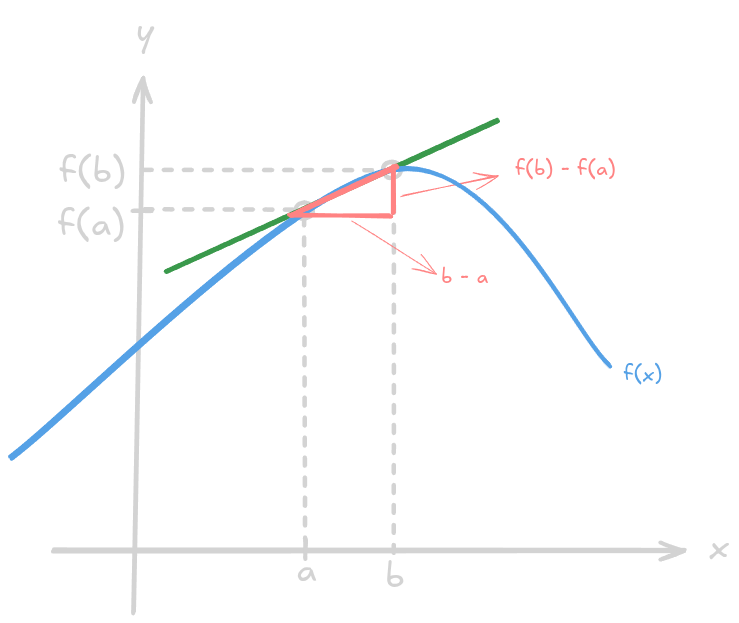
So we have a right triangle in which the adjacent side is equals to and the opposite side is . With this information we can now apply the slope equation:
But we do not care about the slope at , actually we want to be closer and closer of . For this we can just apply the concept of limits:
Here then is the derivative. The derivative is nothing more than the slope of a tangent line. And to represent it we do not use , instead we use the following:
Another common way to represent it is introducing another variable called , which represents :
Finally, now that we have the slope of the tangent line, we can build the equation of the tangent line:
in which:
- is the ordinate of the line at point
- is the abscissa of the point where the tangent touches the curve
- is the slope of the tangent line at
- is a point near where we want to estimate
Linear Approximation
Ok, so now that I know how to calculate the tangent line of a function at certain point, it’s time to apply it.
The thing with the tangent line is that it allows us to estimate the value of for a given near on the original curve. It’s because the tangent line at a specific point closely approximates the behavior of the original graph near that point.
See the following image:
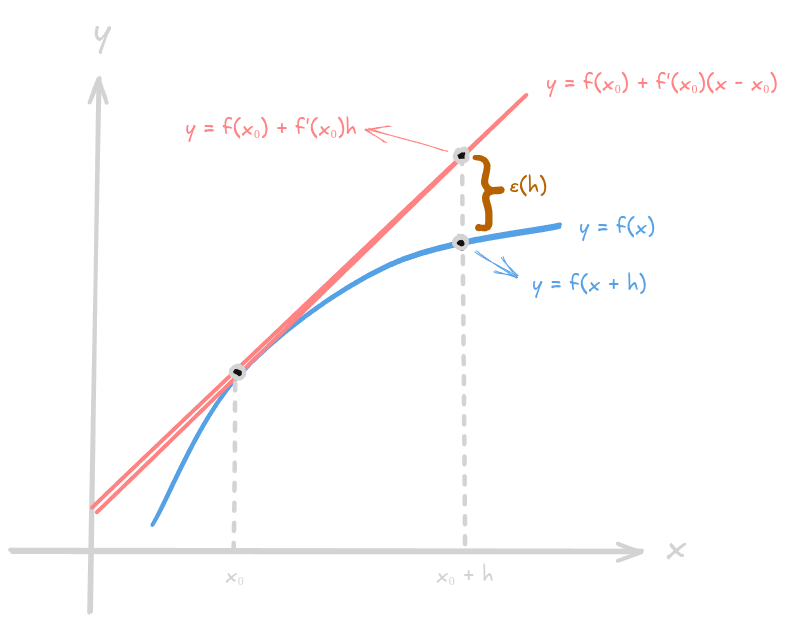 The tangent line near the point closely approximates the actual behavior of the function. However, as we move farther away from , the tangent line increasingly diverges from the function’s true behavior.
We call the difference between of the tangent line in a certain point and the actual function at same point. So is actually the error of the linear approximation. The formula for is:
In which:
- is the difference between and
- is the value of at a certain point on the tangent line
- is the actual value of at a certain point
This formula is interesting because with some manipulation we can prove that the error tends as comes closer to :